How to add a monitor to API Spector Cloud
 Roy de Kleijn · · 2 min read
A monitor in API Spector Cloud is a scheduled check that runs a real request against your API and alerts you when it breaks. It is not just "is the URL up": a monitor can log in, call a protected endpoint, and assert on the body, so it catches the failures a plain ping sails past.
1. Open the Monitors page
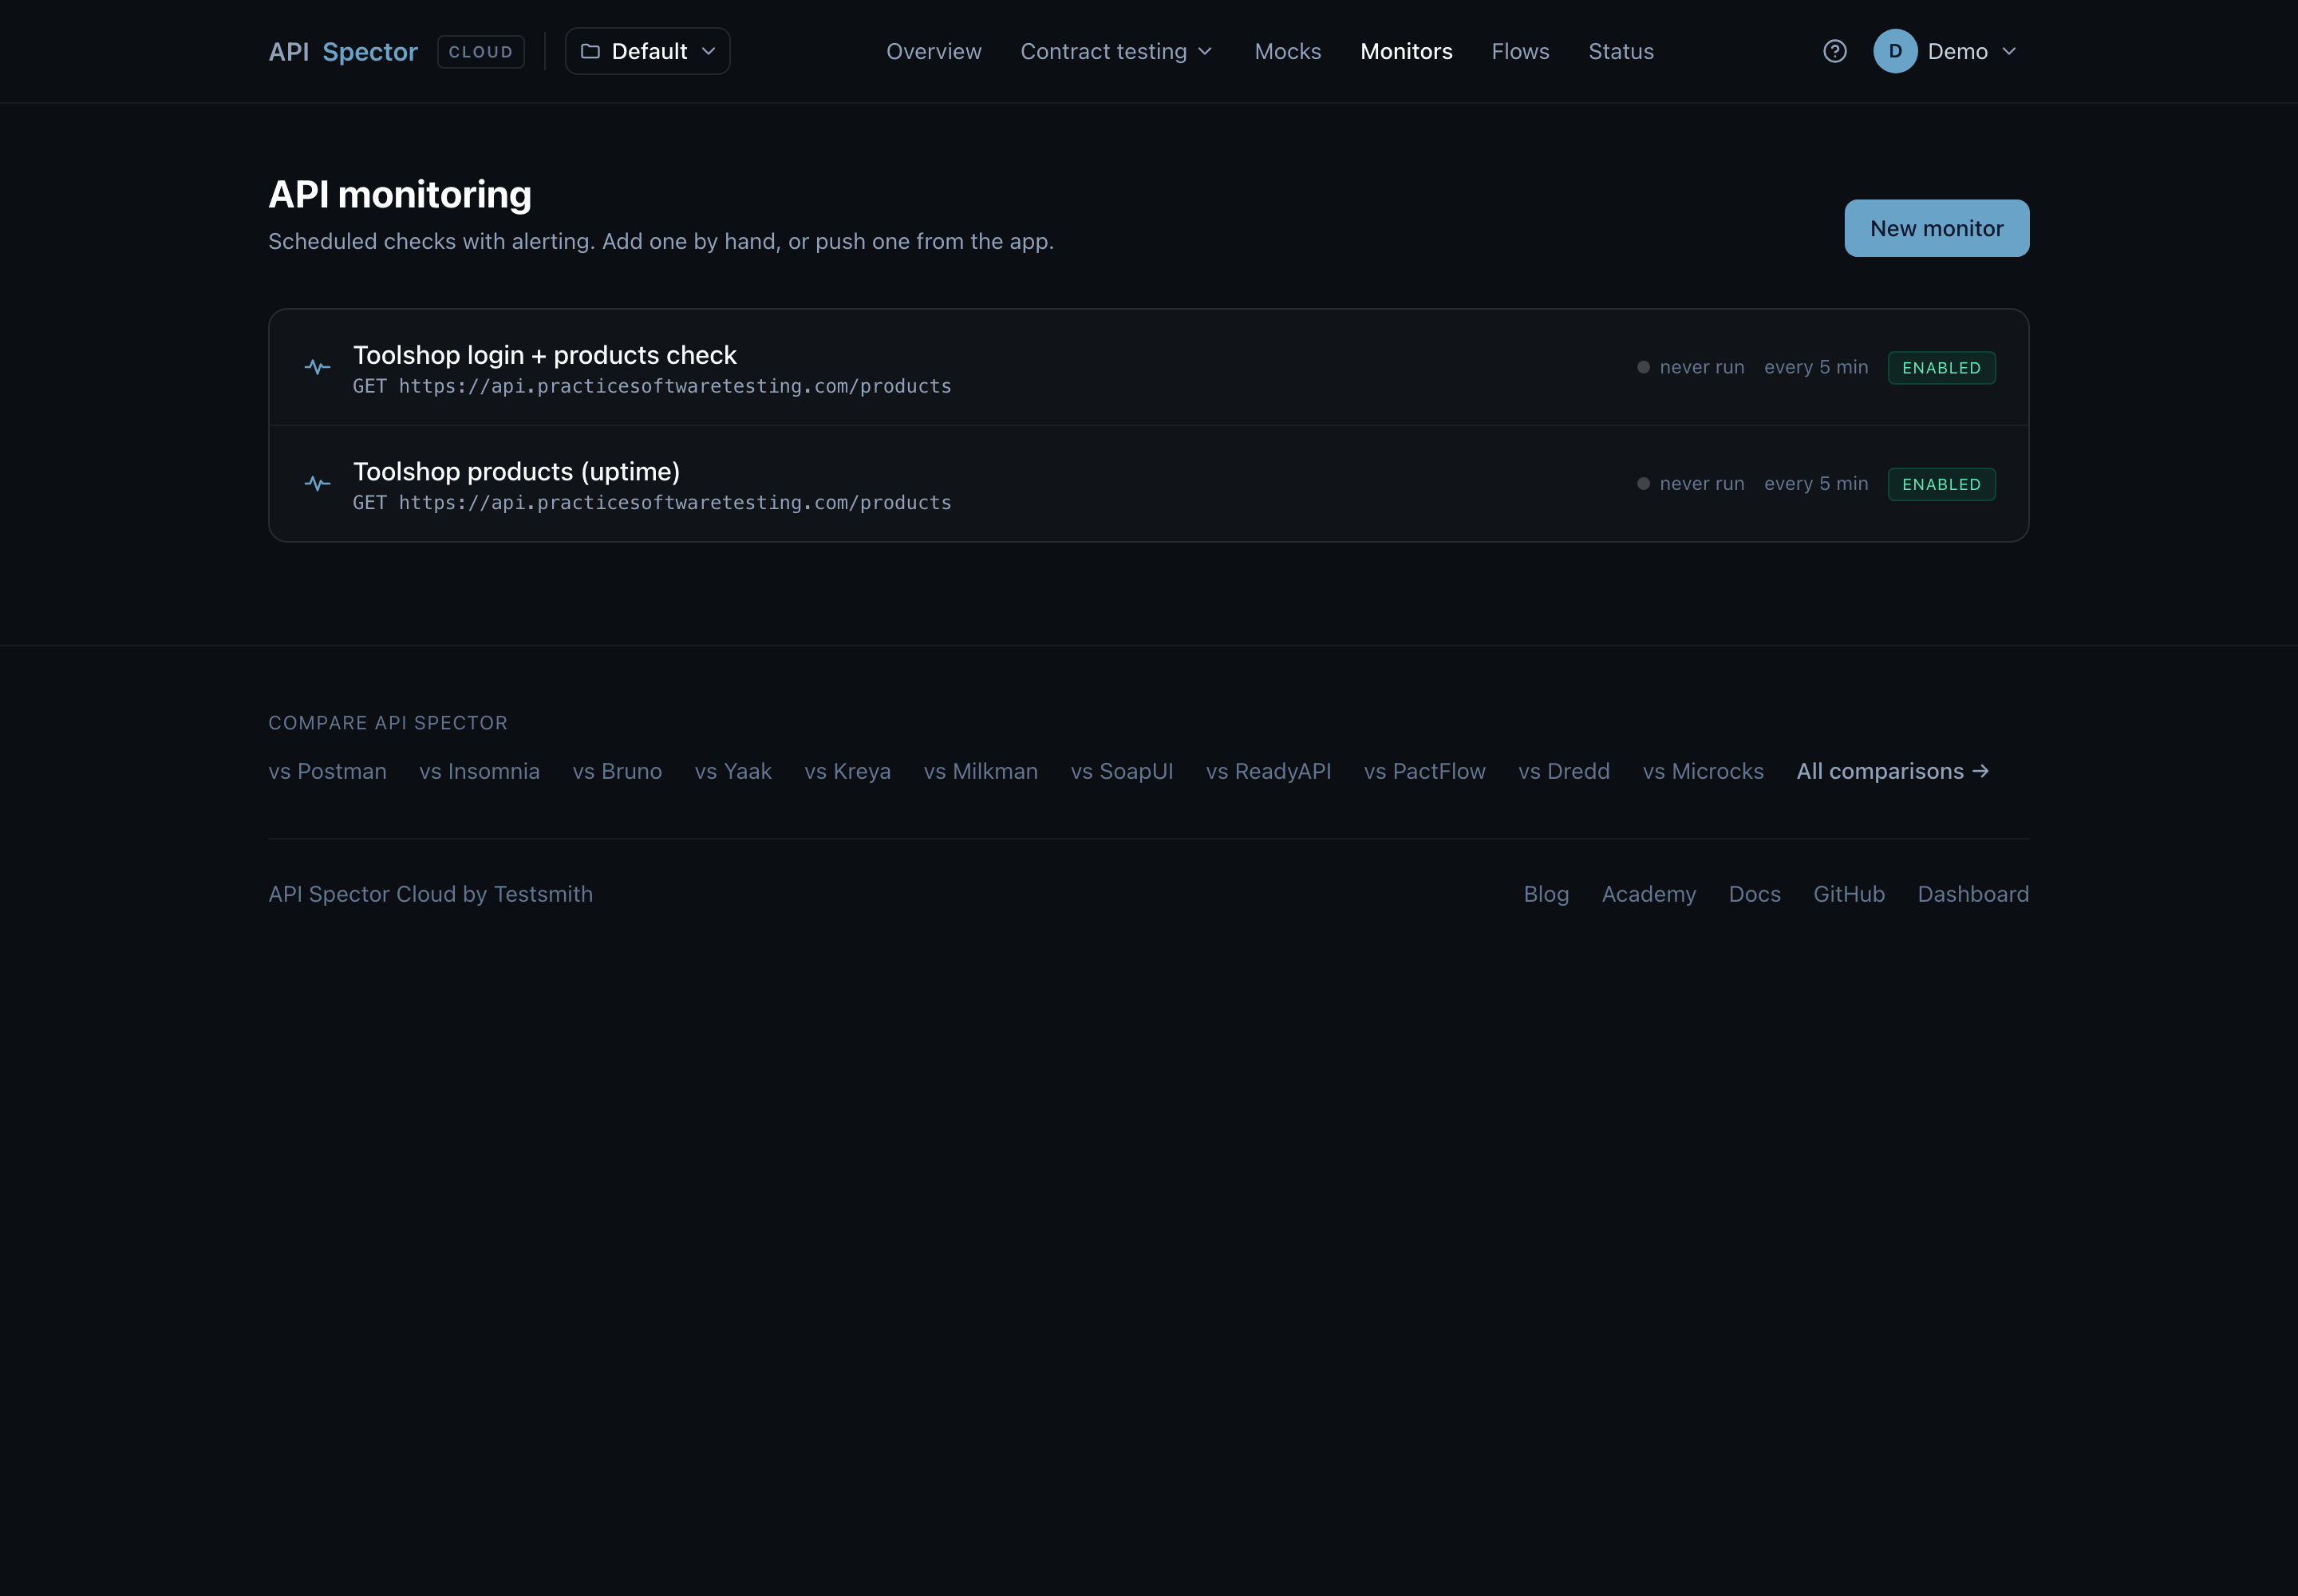
In the cloud dashboard, open Monitors. Add one by hand here, or push one from the desktop app.
2. Create the check
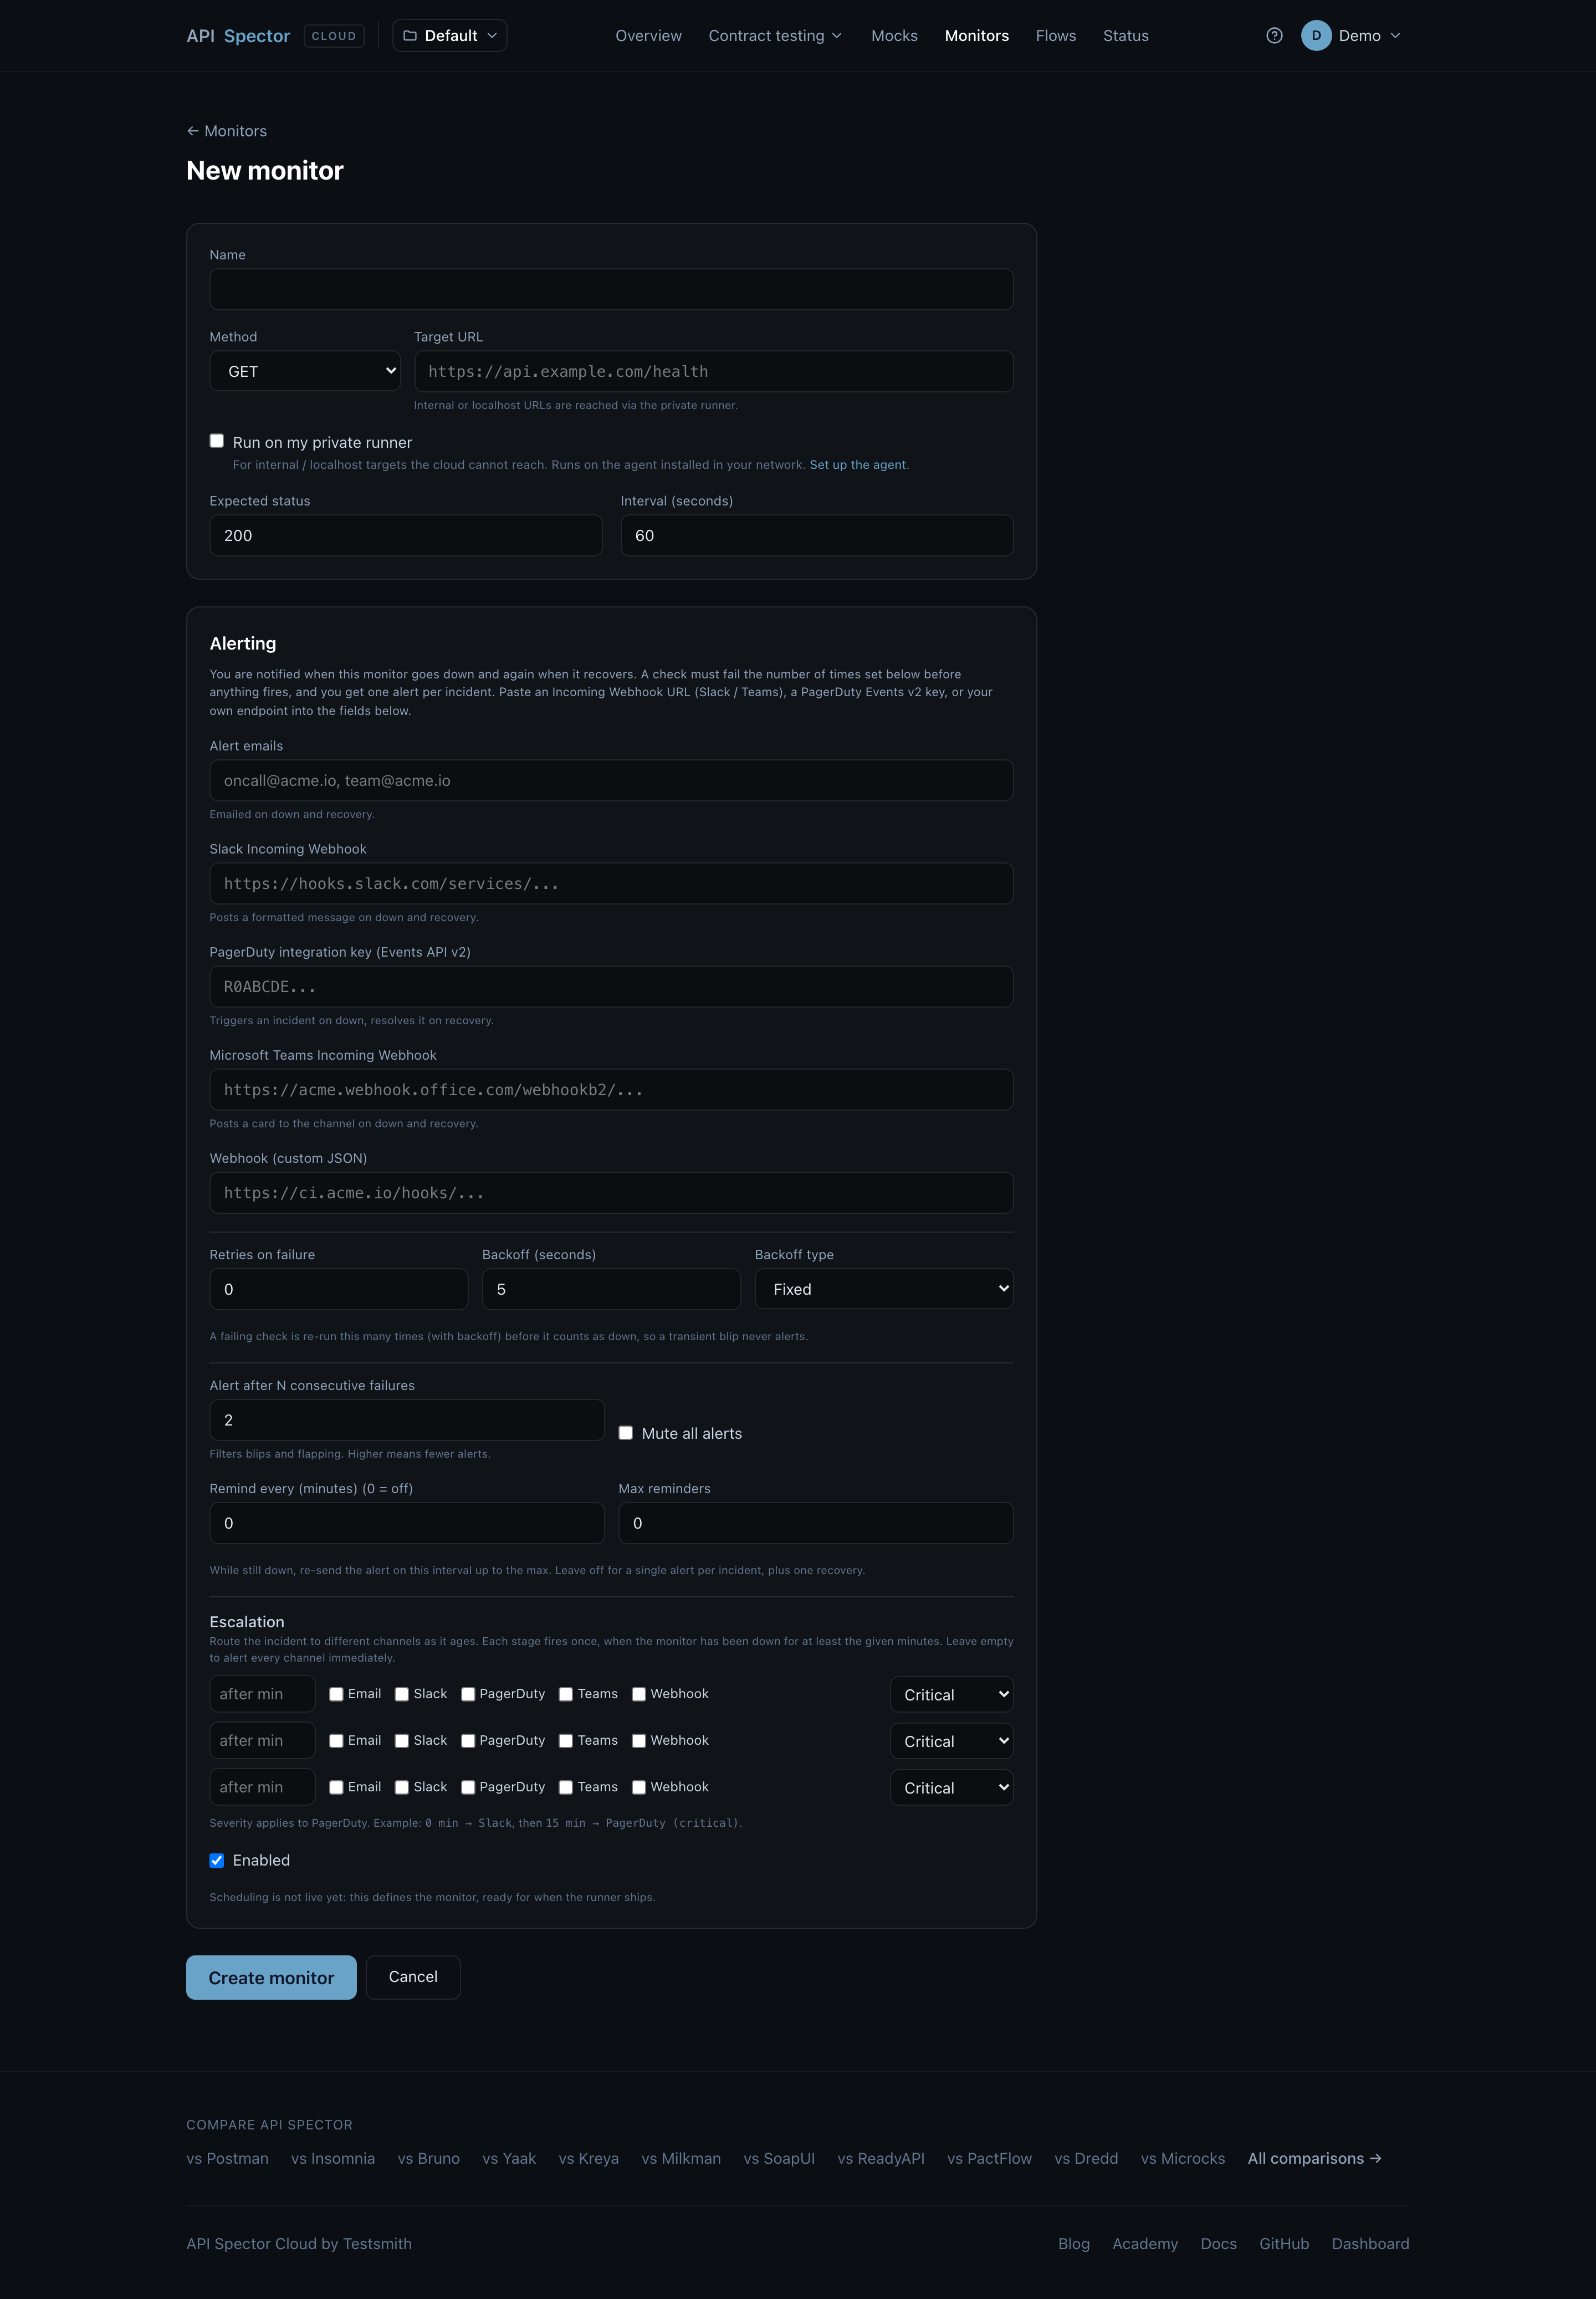
Click New monitor. Give it a target URL, a method, the status you expect, and a check interval (the fastest interval is set by your plan).
3. Add a setup step and assertions
This is what makes it a monitor and not a ping. A Setup step runs first, for example a login, and the variables it sets carry into the check. The Check request can send those variables (like Authorization: Bearer {{token}}) and assert on the response with sp.test(...).
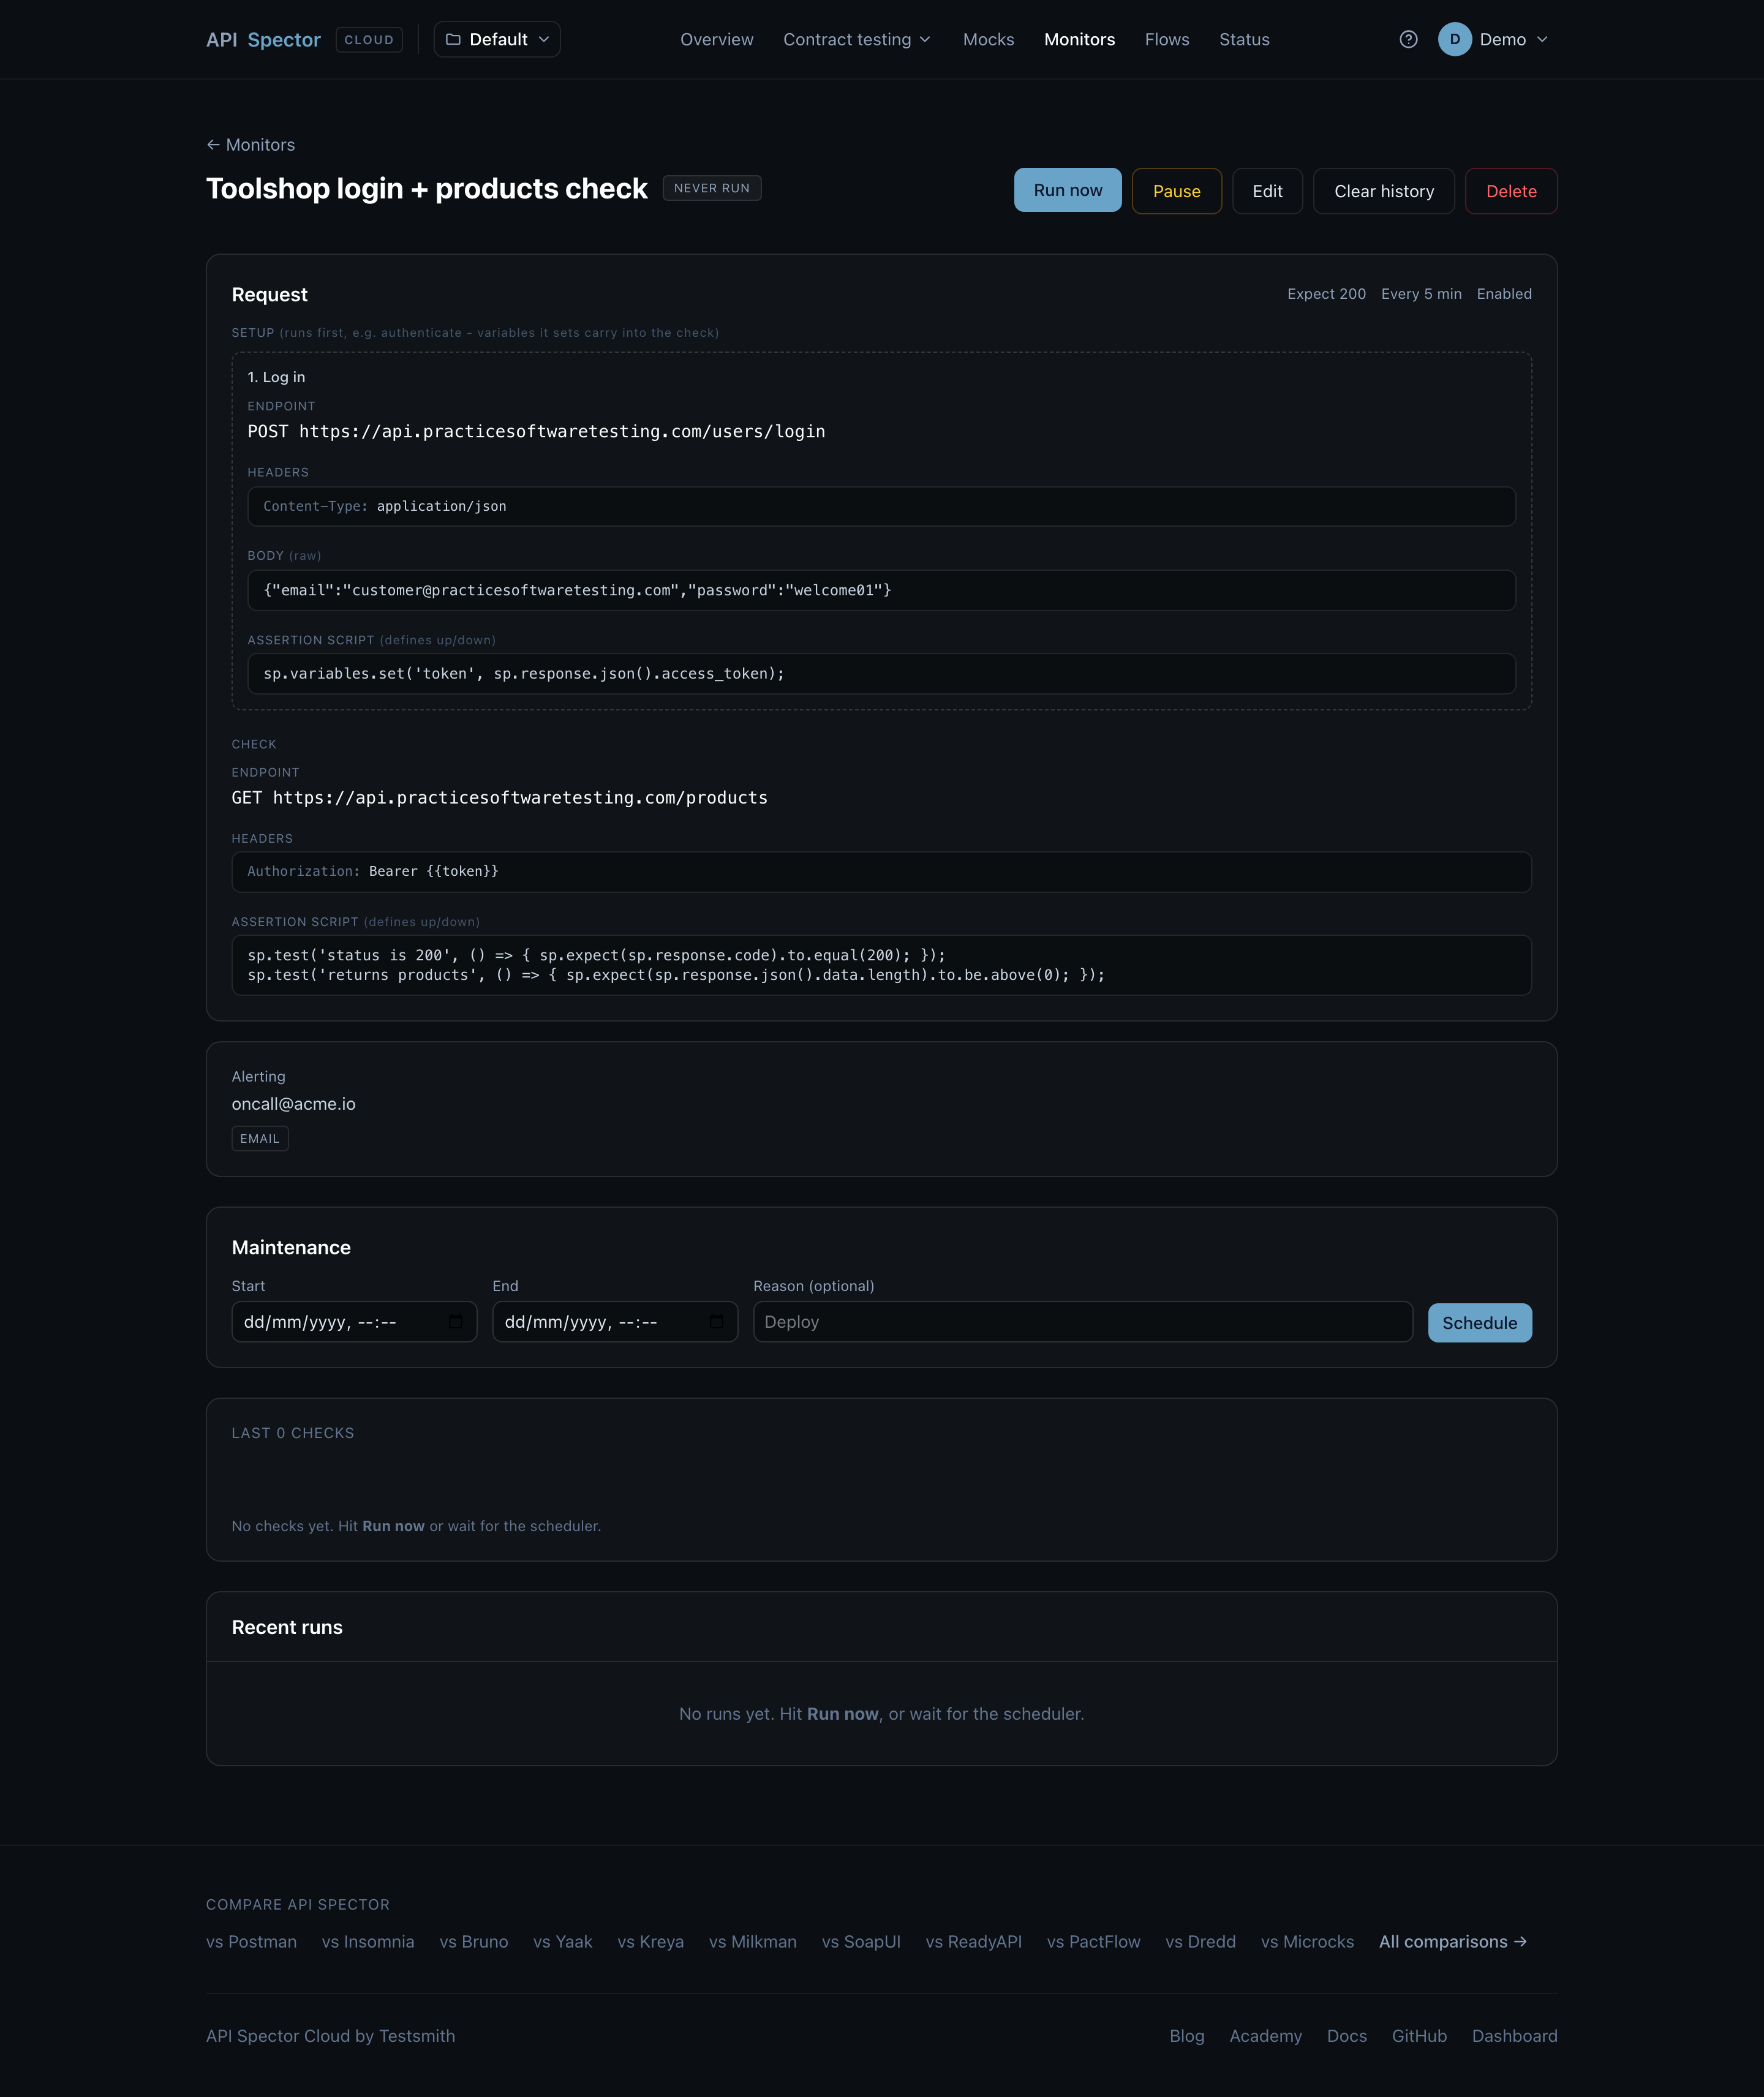
In the monitor above, the setup step logs in to the Toolshop API and captures the token, then the check calls /products and asserts that the status is 200 and the list is not empty. If an assertion fails, the check counts as down.
4. Set up alerting
Add alert channels: email, Slack, PagerDuty, Teams, or a webhook. Alerts fire after a configurable number of consecutive failures, and retries and escalation routes mean a single blip does not page anyone. Schedule a maintenance window to mute alerts during a planned deploy.
Why it matters
Uptime pings miss the failures that actually hurt: auth broke, a field vanished, the body came back empty with a 200. A monitor that runs a real, scripted request and asserts on the result catches those, and routes the alert to the right people.