How to visualize a response as a table in API Spector
 Roy de Kleijn · · 2 min read

When an endpoint returns a JSON array, reading it as raw text is slow. API Spector can show the array as a sortable table, and export it to CSV.
1. Send a request that returns an array
Point a request at an endpoint that returns a JSON array, for example a list of users or products, and press Send.
2. Switch the response body to Table
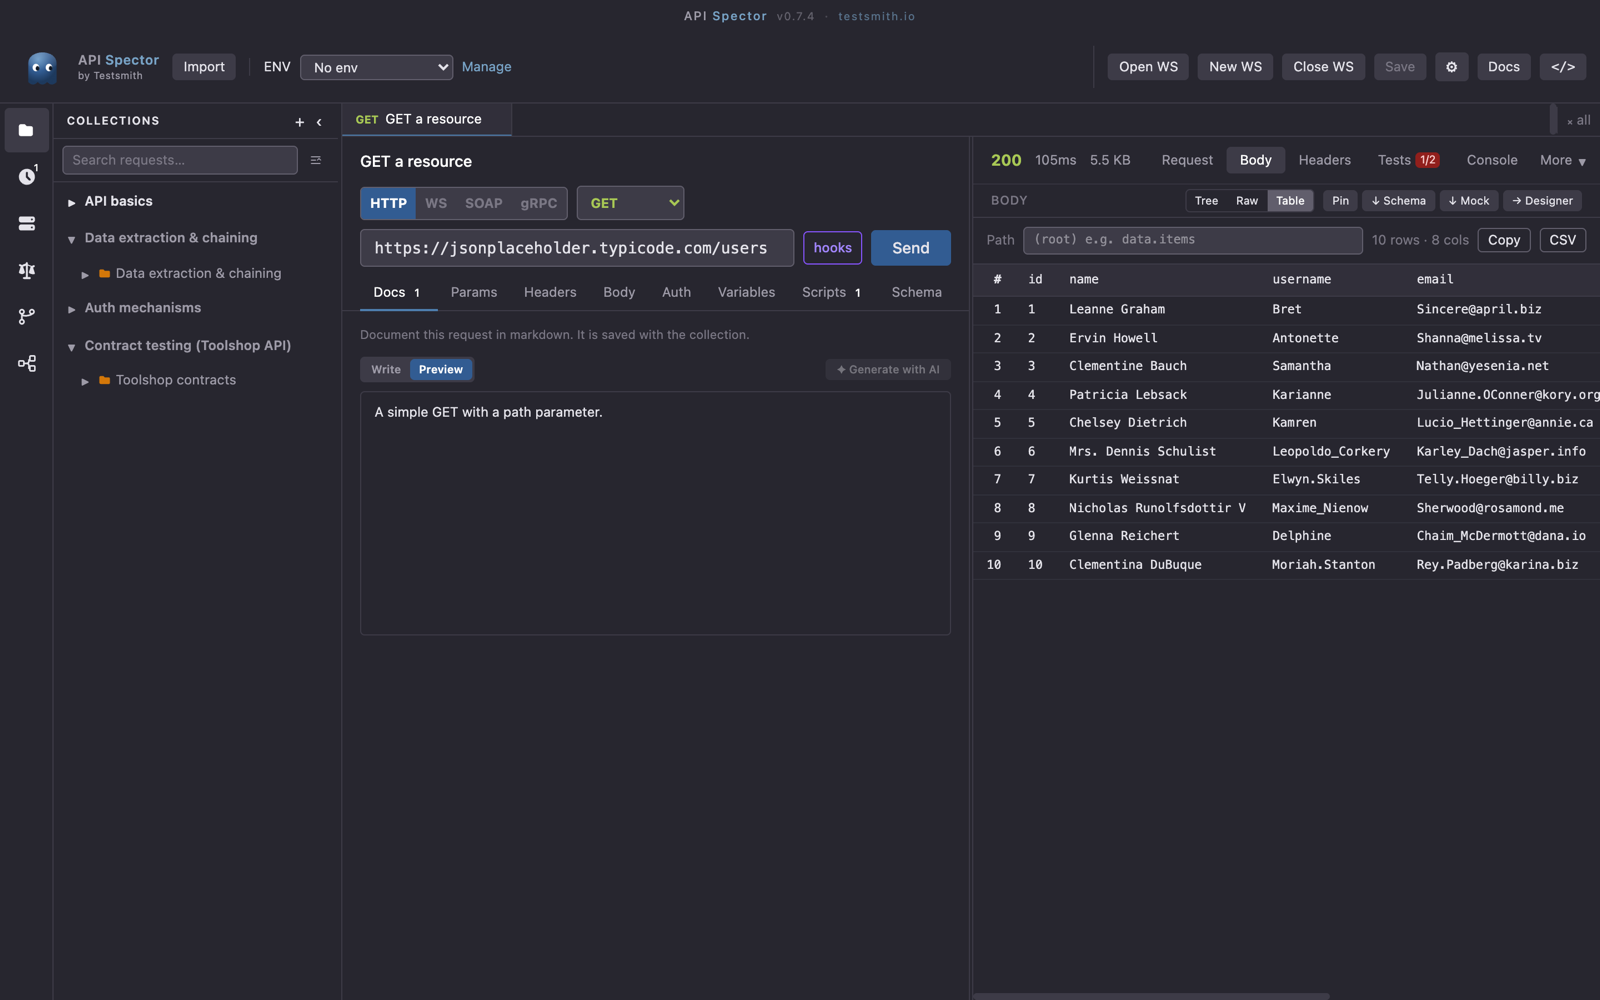
The response body has three view modes: Tree, Raw, and Table. The Table mode appears when the body is an array. Select it to see one row per item and one column per field. The header shows how many rows and columns there are.
3. Sort
Click a column header to sort by that field, and click again to reverse the order. This makes it easy to scan a large list for the largest, smallest, or alphabetically first value.
4. Copy or download as CSV
Use Copy to put the table on your clipboard, ready to paste into a spreadsheet, or Download CSV to save it as a .csv file. The export uses the current sort order and includes every row, not just the ones on screen.
For a single object (not an array), the table shows a field-and-value grid instead, which you can export the same way.